SpringCloud Hystrix 配置监控
HystrixDashboard 是什么
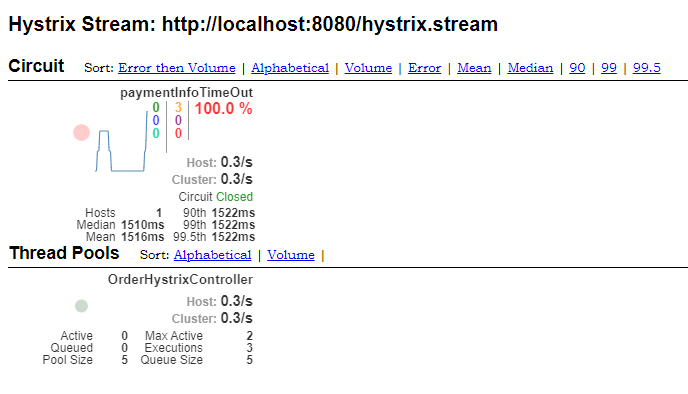
Hystrix Dashboard 是一款针对 Hystrix 进行实时监控的工具,通过 Hystrix Dashboard 可以直观地看到各 Hystrix Command 的请求响应时间,请求成功率等数据。
配置监控界面
参考资料 官方文档地址
添加上如下依赖
<!-- https://mvnrepository.com/artifact/org.springframework.cloud/spring-cloud-starter-netflix-hystrix-dashboard -->
<dependency>
    <groupId>org.springframework.cloud</groupId>
    <artifactId>spring-cloud-starter-netflix-hystrix-dashboard</artifactId>
</dependency>

<!-- 然后还需加上这两个依赖 -->
<!--web-->
<dependency>
    <groupId>org.springframework.boot</groupId>
    <artifactId>spring-boot-starter-web</artifactId>
</dependency>
<dependency>
    <groupId>org.springframework.boot</groupId>
    <artifactId>spring-boot-starter-actuator</artifactId>
</dependency>
然后在启动类加上 @EnableHystrixDashboard 注解
@SpringBootApplication
@EnableEurekaClient
@EnableFeignClients
@EnableHystrix
@EnableHystrixDashboard
public class EurekaClientApplication {
    public static void main(String[] args) {
        SpringApplication.run(EurekaClientApplication.class, args);
    }
}
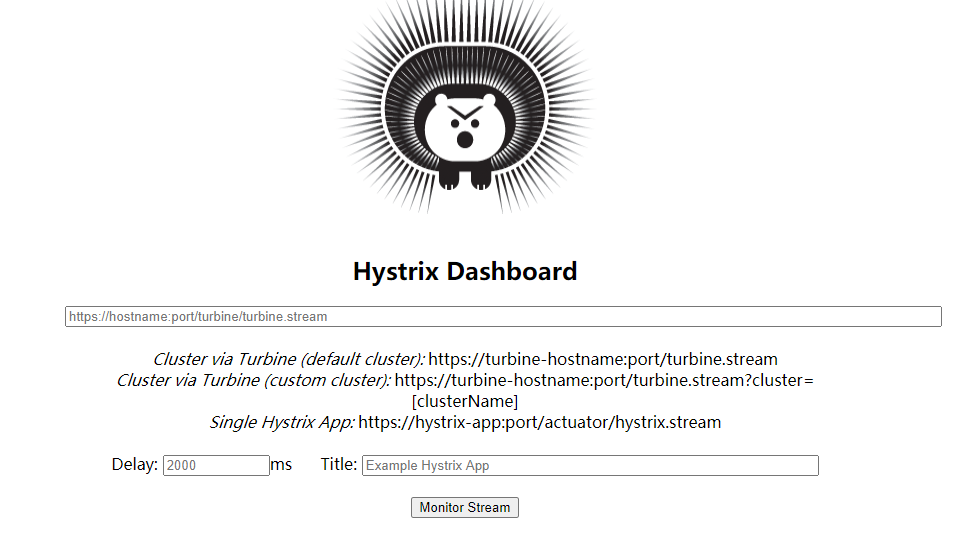
然后访问 /hystrix 就能进到监控界面了
http://localhost:8080/hystrix
升级版本之后手动配置
官方文档上写了:Then visit /hystrix and point the dashboard to an individual instance’s /hystrix.stream endpoint in a Hystrix client application.
大意就是把仪表盘映射到 /hystrix.stream 下面,所以找个地方添加上这个 Bean(启动类也行)
@Bean
public ServletRegistrationBean getServlet() {
    HystrixMetricsStreamServlet streamServlet = new HystrixMetricsStreamServlet();
    ServletRegistrationBean registrationBean = new ServletRegistrationBean(streamServlet);
    registrationBean.setLoadOnStartup(1);
    registrationBean.addUrlMappings("/hystrix.stream");
    registrationBean.setName("HystrixMetricsStreamServlet");
    return registrationBean;
}
然后还需要将这个允许代理的列表(修改配置文件),以及打开 spring-boot-starter-actuator 的监控配置
# 添加 Stream 到允许代理列表
hystrix:
  dashboard:
    proxy-stream-allow-list: "*"

management:
  endpoints:
    web:
      exposure:
        include: "*"
  endpoint:
    health:
      show-details: always
然后访问 /hystrix 就能进到监控界面了
http://localhost:8080/hystrix
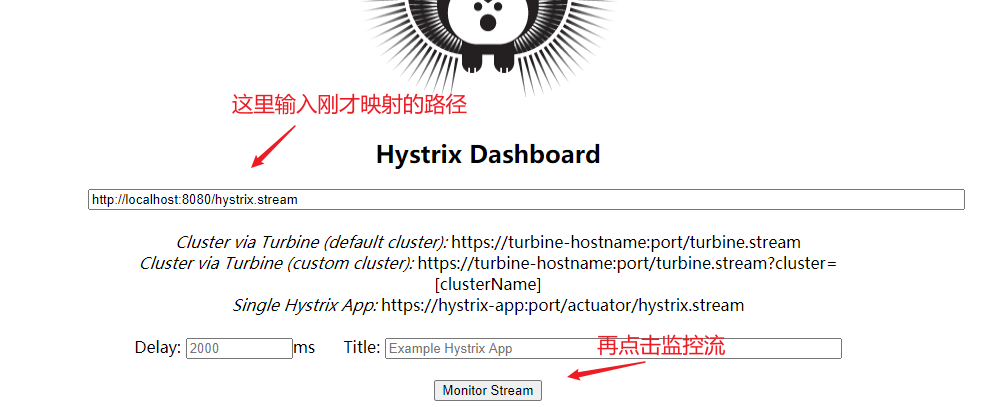
这时再把地址填入
http://localhost:8080/hystrix.stream
注意,一直显示 Loading… 是因为它在等待负载均衡的提供方去消费服务,即访问负载均衡服务器,去调用客户端。如果想让图中的数据发生变化,则需要循环多次的去访问负载均衡的提供方,让其消费服务,以至于达到监控的目的。